
1. 아키텍처 구성
프로메테우스는 다른 vm 에 구축된 서비스/시스템의 메트릭, 로그를 수집해야한다는 것을 감안해서 구축해야한다.
[VM1] Node Exporter 컨테이너 (포트 9100)
[VM2] Node Exporter 컨테이너 (포트 9100)
[모니터링 서버 VM] Prometheus 컨테이너 (포트 9090) + Grafana 컨테이너 (포트 3000)
2. 모니터링 서버 vm 설정
2.1 Prometheus 구성
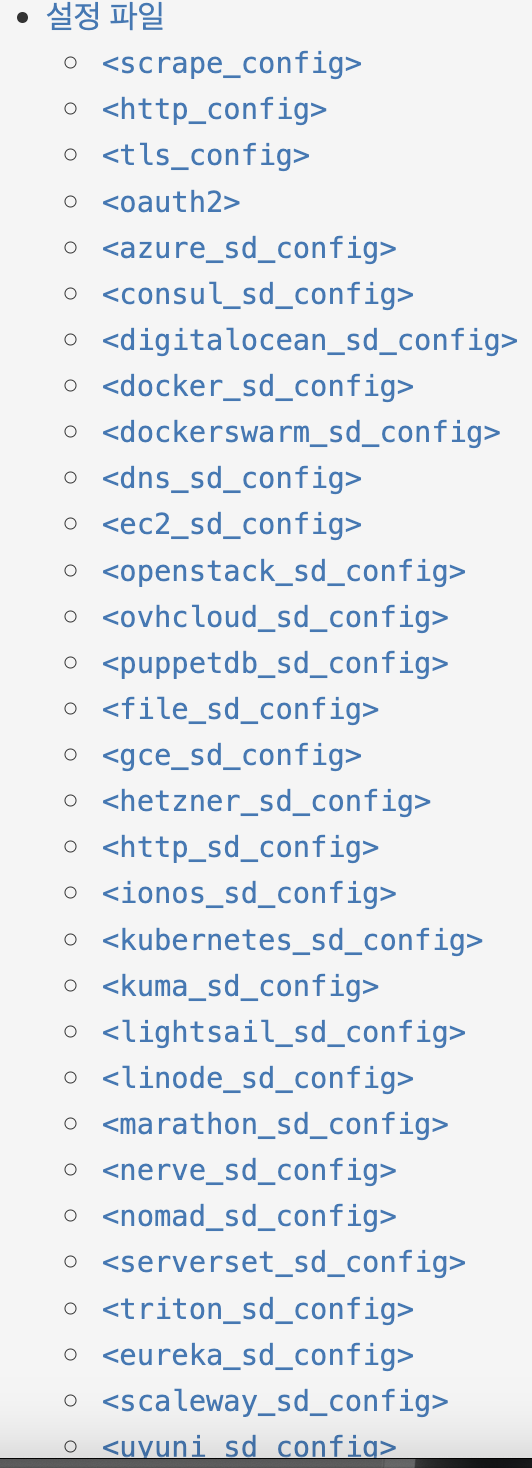
config 예제 파일
https://github.com/prometheus/prometheus/blob/release-3.1/config/testdata/conf.good.yml
prometheus/config/testdata/conf.good.yml at release-3.1 · prometheus/prometheus
The Prometheus monitoring system and time series database. - prometheus/prometheus
github.com
prometheus docs
https://prometheus.io/docs/prometheus/latest/configuration/configuration/
Configuration | Prometheus
An open-source monitoring system with a dimensional data model, flexible query language, efficient time series database and modern alerting approach.
prometheus.io
필요한 옵션을 추가하면 되는데,
아직은 정확히 뭐가 필요한지 잘 모르겠어서 블로그 대로 참고하며 진행해보겠다.
살펴보니, job에 따라서 name 과 metric주소를 달리할 수 있는 것 같다.
아직은 수집할 데이터가 없어서...
프로메테우스 구축에만 초점을 맞추겠다.
prometheus.yaml 작성 및 rule.yaml 작성
https://prometheus.io/docs/prometheus/latest/configuration/alerting_rules/
Alerting rules | Prometheus
An open-source monitoring system with a dimensional data model, flexible query language, efficient time series database and modern alerting approach.
prometheus.io
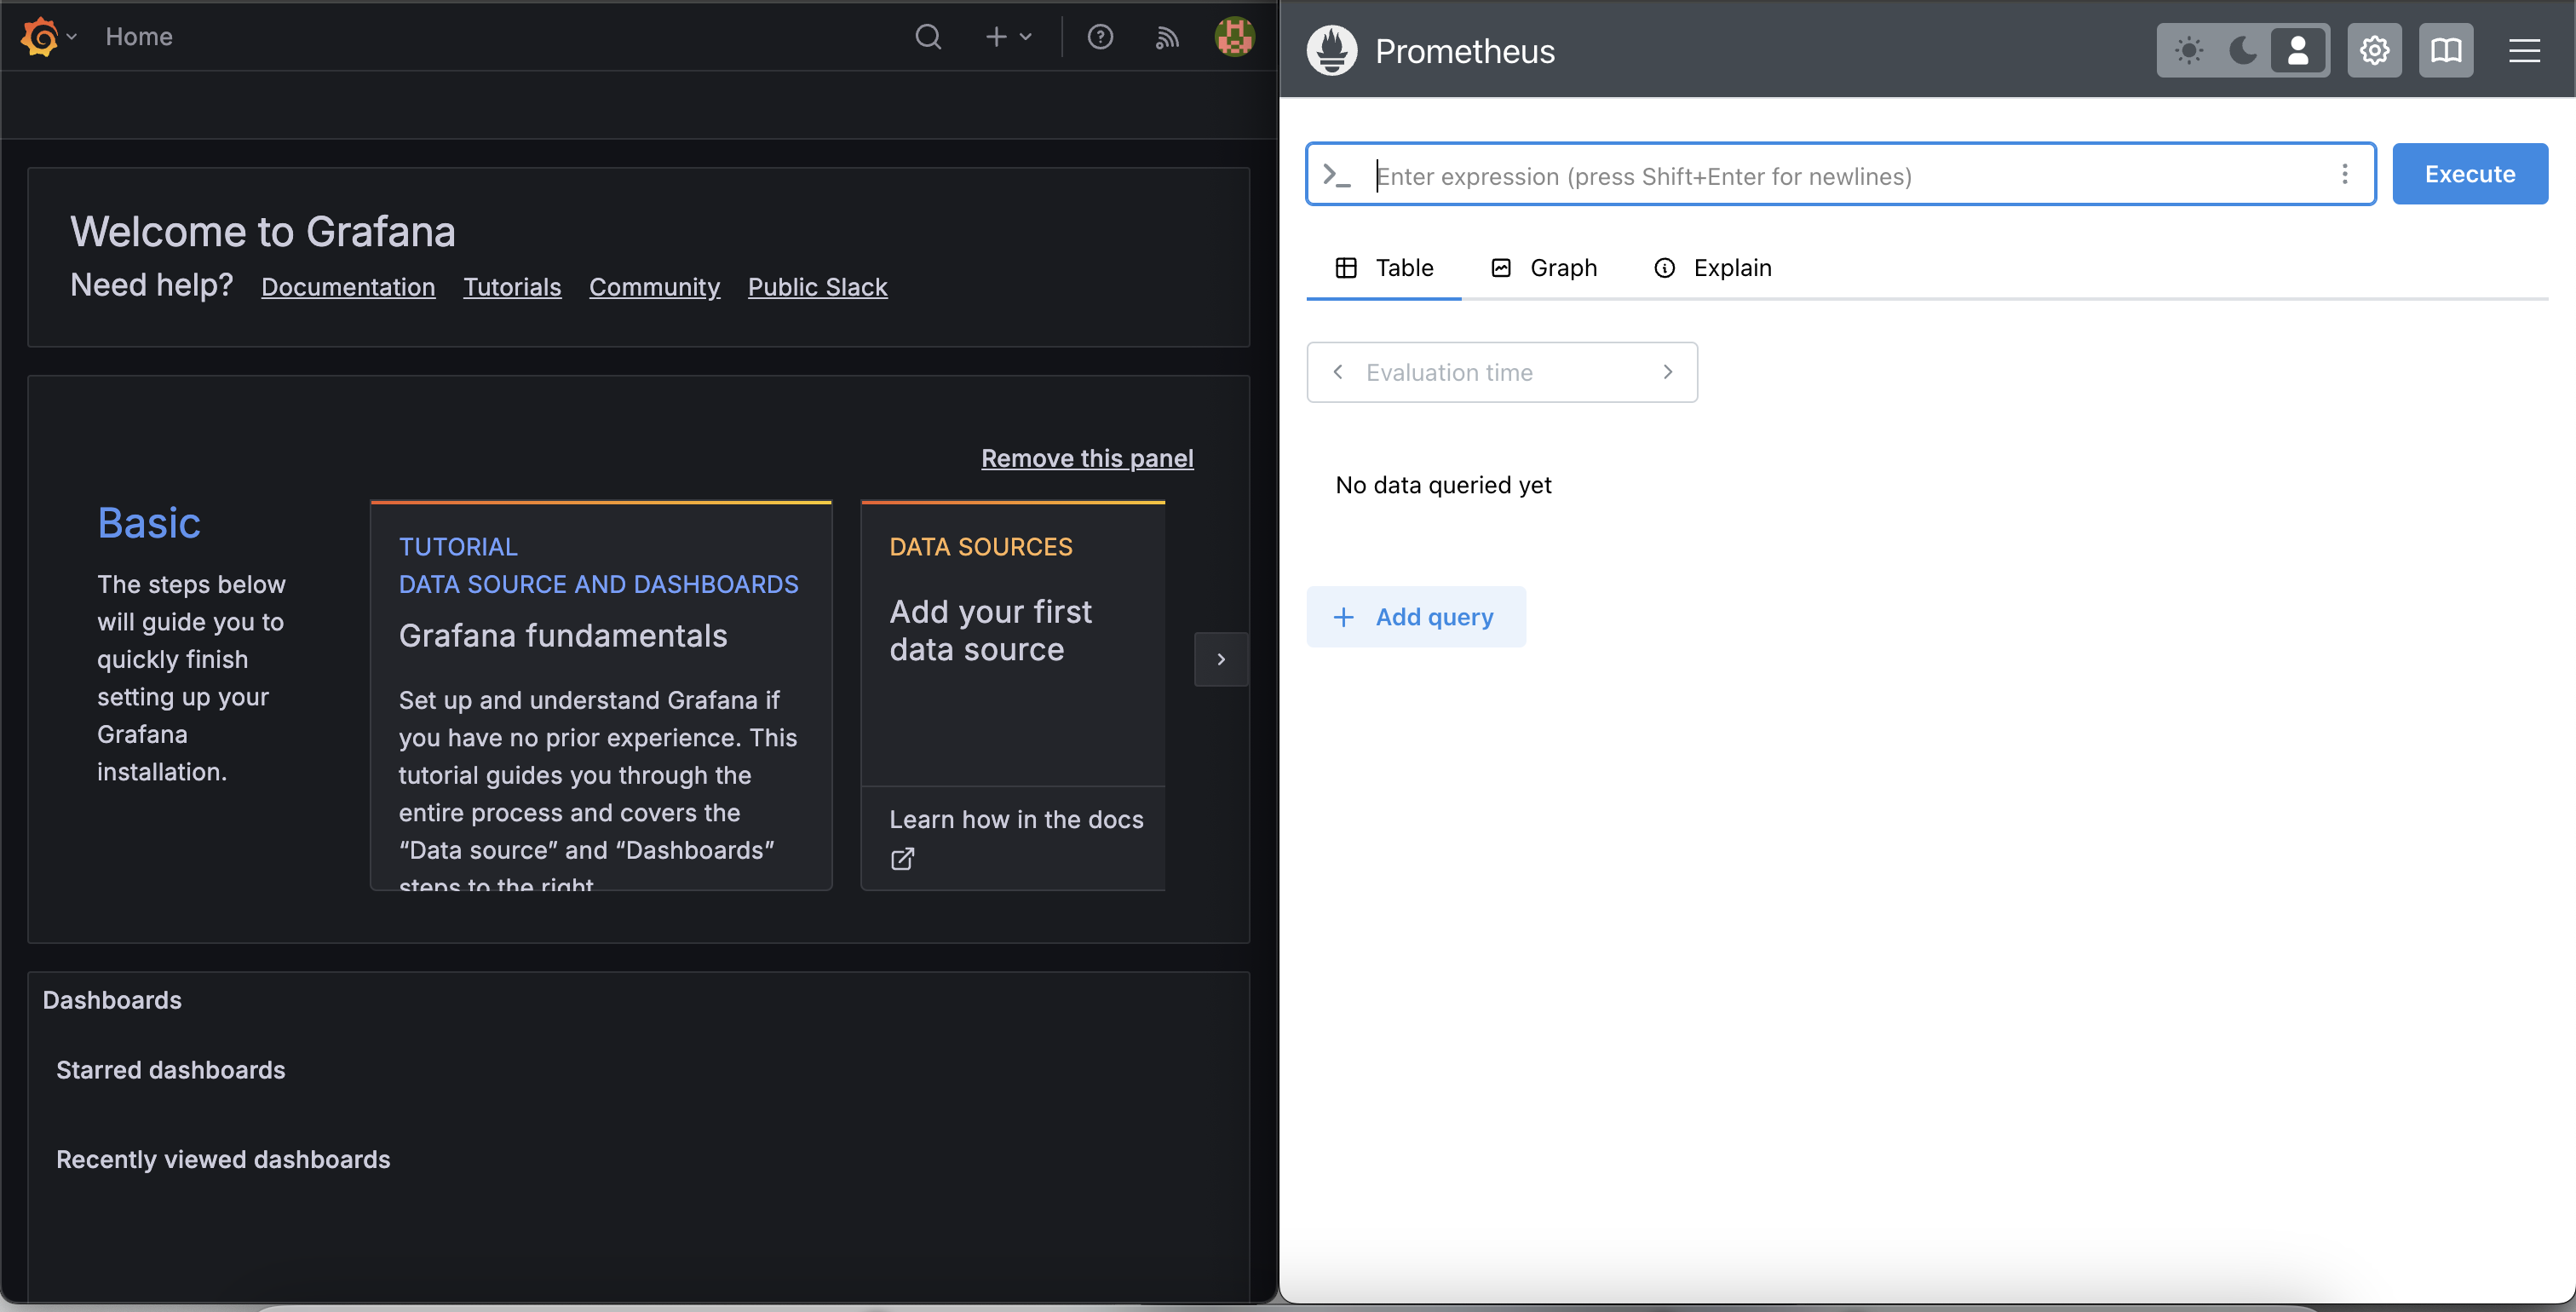
구축은 위 블로그와 docs , docker-compose 를 이용해서 간단하게 마무리했다.
이제 다음 게시물에서는,
- spring 임의 api 를 만들어서 로그 수집을 진행해보겠다.
- vm 시스템의 메모리와 같은 데이터 수집 방법도 찾아보겠다.
- ansible 로 할 수 있는 무언가도 찾아보면 좋을 것 같다. ( 왜냐하면 배운뒤로 안써먹어서 까먹었기 때문..)
소스코드는 아래 링크에 올려두었다.
https://github.com/pinetree2/heartbeat-prom
GitHub - pinetree2/heartbeat-prom: prometheus 관련 레포지토리입니다.
prometheus 관련 레포지토리입니다. Contribute to pinetree2/heartbeat-prom development by creating an account on GitHub.
github.com
'☁️2024,2025☁️ > Cloud' 카테고리의 다른 글
| [ Monitoring ] 인프라 모니터링 파이프라인 설계하기 #3 (0) | 2025.02.06 |
|---|---|
| CloudClub 7기 리크루팅 홍보 및 5~6기 회고 (0) | 2025.01.26 |
| [ Monitoring ] 인프라 모니터링 파이프라인 설계하기 #2 (0) | 2025.01.10 |
| [ Monitoring ] 인프라 모니터링 파이프라인 설계하기 #1 (0) | 2025.01.10 |
| [ AWS ] aws 서비스 살펴보기 #1 (1) | 2024.12.03 |